My view of varroa mites and how to handle them has evolved this past year. I started out as a beekeeper not wanting to treat for mites. Then became a beekeeper who wasn’t worried about the mites because he had first year hives. Then finally a beekeeper who monitored for mites and treated during our warm winter. Around November 2015 I started recording the mite drop on my two Langstroth hives every few days. With the onset of spring weather I stopped (this past weekend), so it must be time to post some results. I also have some temperature readings from my BroodMinder devices to compare with this data.
I just learned that an active hive generates a lot of debris. Over the winter there are fewer bees, little or no brood, and not much activity. So I was able to see and count the mites on the bottom boards every 3 to 8 days. I looked at the boards this past weekend and there was a lot of debris. A LOT of debris. Clearly it was time to stop counting mites in this manner. I’m hoping to do a sugar shake test in the next few weeks, which would give a more accurate measure of the in-hive mite count.
Counting Mites
It started around American Thanksgiving weekend, on November 25. I pulled the screen bottom boards to take a peek, and immediately saw 20+ mites under each hive. I counted them every few days from then on. The dead mites showed up pretty well throughout the winter; I never used a sticky solution or other substance. I just counted the dead mites on the board. Research has shown that most of the mite drop is from dead mites in any case, so I figured this was a solid ongoing way to see how the mites change over the winter months.
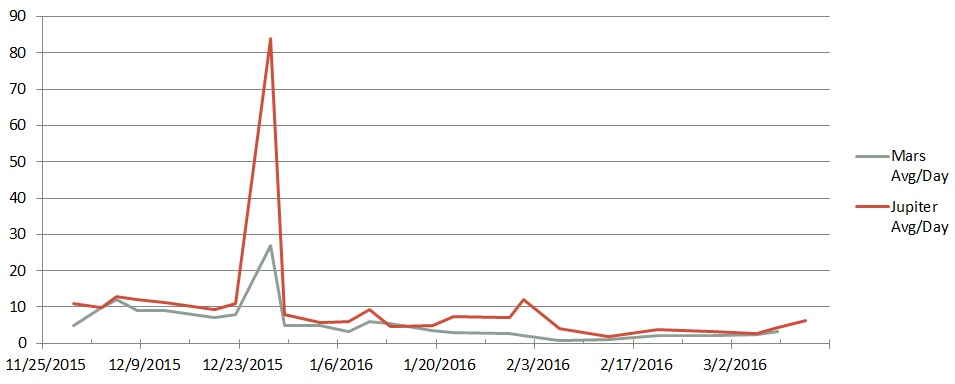
Unfortunately I never took a picture of the winter boards, though I did track the numbers. The below graph shows the average daily mite drop from Mars and Jupiter From November 25 to March 12. Mars had three boxes (one deep, two mediums), while Jupiter two (one deep, one medium).
(C) Erik Brown
The spike in this graph is when I applied a single mite-away quick strip (MAQS) to each hive. In retrospect it would have been interesting to see how the mites progressed through the rest of the winter, as there is a general downward trend in the first month (this is more apparent in the second graph below). We had a string of warm days just before Christmas, however, and I decided to treat before the cold weather set in. I wanted to keep my bees alive more than I wanted to watch the numbers fluctuate.
The strips (one in each hive) were removed 5 days later. Mars dropped a meager 135 mites (27 per day), while I was able to count 420 mites (84 per day) from Jupiter. What a way to spend a December 27! Counting mites in the bee yard. After this short treatment, the mite load was definitely lower, though not really significantly lower. Killing over 500 mites must be good, right?
Fun with Numbers
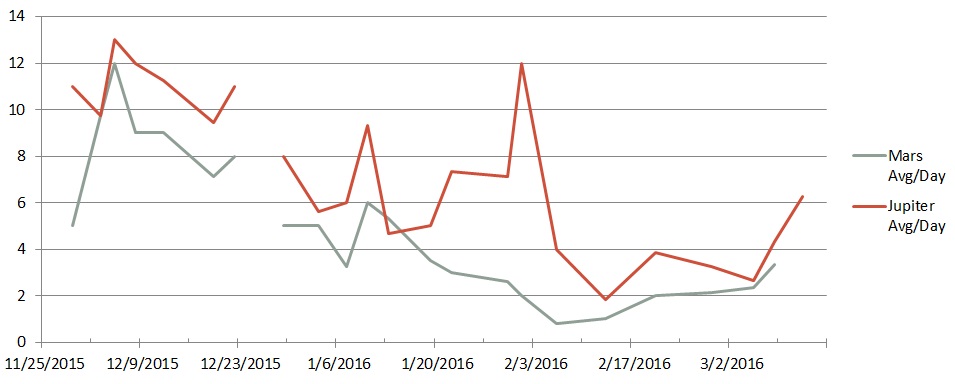
Here is the exact same graph with the MAQS-induced spike removed. This gives you a better sense of the trends throughout the period, and expands the range so you can more easily see each data point.
(C) Erik Brown
The overall downward trend is now readily apparent. Notice how the trend continues until mid-February, then seems to level out and start to trend upward into March. Both hives are Russian bees, known to have empty brood nests over the winter, and there was literally zero brood in the hives in late October (it kind of freaked me out). So perhaps the mites would have dwindled away throughout the winter, as they seemed to do throughout January. A test for another year, I suppose.
These observations are also supported by the temperature data. I placed a BroodMinder sensor at the top of both hives in December to record the temperature and humidity. The humidity readings turned out to be error-prone, and the company is in the process of replacing these devices with a more accurate humidity sensor. There is a companion site beekeeping.io where you can visualize your data. Using this site I pulled a graph of the temperature at the top of Mars in contrast with the outside temperature.
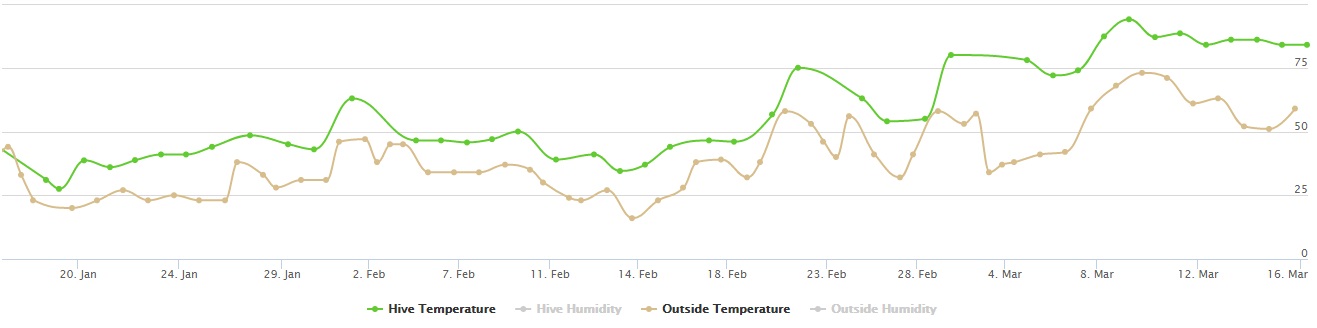
Temperature graph for Mars. The graph for Jupiter is nearly identical. (C) Erik Brown
The beekeeping.io site lets you define one or more apiaries, then one or more hives for each apiary, and then one or more sensor devices for each hive. A phone app grabs the sensor data via Bluetooth, and from there you can email a data file to beekeeping.io. The site aggregates and displays data at the apiary level, on a per-hive basis, or by device. It is very well done, with the graph of the Mars data shown here. I do not show the humidity information since it is not really accurate.
If you can make out the numbers (click on the graph to see a larger version), the hive temperature (green line) hovers near 50 F (10 C) for most of January and into February while the outside temperature (the tan line) ranges from 16 to 47 F (-9 to 8 C). Remember this is the temperature above the cluster — most likely the cluster itself was a bit warmer. Around February 20 the temperatures start to heat up both within and outside the hive, until the last week or so when the top of the hive is fairly steady around 80 F (27 C).
During January, the lack of brood allows Russian bees to lower the temperature in the hive and conserve energy, meaning they consume less honey. Hence the lower temperature. This behavior developed in Russia where the bees may live inside the hive for as long as six months. As a result, Russian bees can generally survive a winter on fewer honey stores and with fewer bees than other races, most notably Italian bees.
As Spring approaches a higher temperature is needed to create and expand the brood nest, until the flowers start to emerge and the brood nest expands (this weekend it was 3-4 frames). The hive temperature is more carefully regulated as bee larva require a somewhat constant temperature of 95 F (35 C). Kind of interesting that this is right near the standard human temperature of 98.6 F.
The BroodMinder team is working on a hive scale that also records outside temperature. This is expected in May, and I’m debating whether to purchase one. It would be interesting to see how the weight fluctuates throughout the year.
As you can see, I do enjoy having fun with numbers.
He that would have eggs must endure the cackling of hens
Once again our title comes from the book The Facts on File Dictionary of Proverbs. It seems to capture the idea that you often have to deal with something unpleasant in order to get what you want. I personally have never really put up with the cackle of hens. My lovely wife grew up on a farm and is pretty insistent about never having chickens. We tend to buy our eggs at the store.
Of course, in the title I replaced eggs with honey and hens with mites. In our area, unless you cage the queen or perform frequent splits you most likely have varroa mites. In fact, even with these methods you probably have some mites. If you want honey, the hive must have time to grow and expand, and you will definitely breed some mites along with your bees.
I managed to find the quote online at thefreedictionary.com and a few other sites, although no mention of the history for this quote. According to The Facts on File book, the proverb was first recorded in 1659. Adding this date as a search term I was able to corroborate this in A Dictionary of American Proverbs on Google Books, published in 1992. Used versions of this book are available on Amazon, so I just ordered a copy of my own. Apparently I like having books on proverbs.

We followed the same progression from wannabe-treatment-free to hey-they-are-first-year-colonies to okay-we-will-monitor-and-treat but it took us longer. Congratulations.
LikeLike
Thanks. If it weren’t for our warm weather I don’t think it would have been possible. Thank goodness my first winter was a mild one.
LikeLike